Spectroscopy Insights: Infrared, UV-Vis, Raman Comparisons
To the naked eye, jadeite is a stone of mystical beauty—but in the lab, it becomes a landscape of energy, structure, and light. Through spectroscopy, gemologists can identify the precise mineral composition, chromophores, and even geological origin of a jadeite sample. This post explores how infrared (IR), ultraviolet-visible (UV-Vis), and Raman spectroscopy are used to decode the deeper story within green jadeite.
🌈 1. How Light Meets Minerals: The Role of Ions
When light passes through or reflects off jadeite, its internal atoms and ions interact with specific wavelengths. These interactions depend on the presence of transition metals such as Fe³⁺, Cr³⁺, Fe²⁺, and Mn²⁺, which absorb energy and cause distinct absorption peaks.
These peaks serve as “spectral fingerprints” that can:
- Reveal the presence of jadeite (NaAlSi₂O₆) vs. omphacite (Na(Ca, Mg, Fe²⁺)Si₂O₆)
- Explain color variations
- Help trace origin by comparing specific peak patterns and shifts
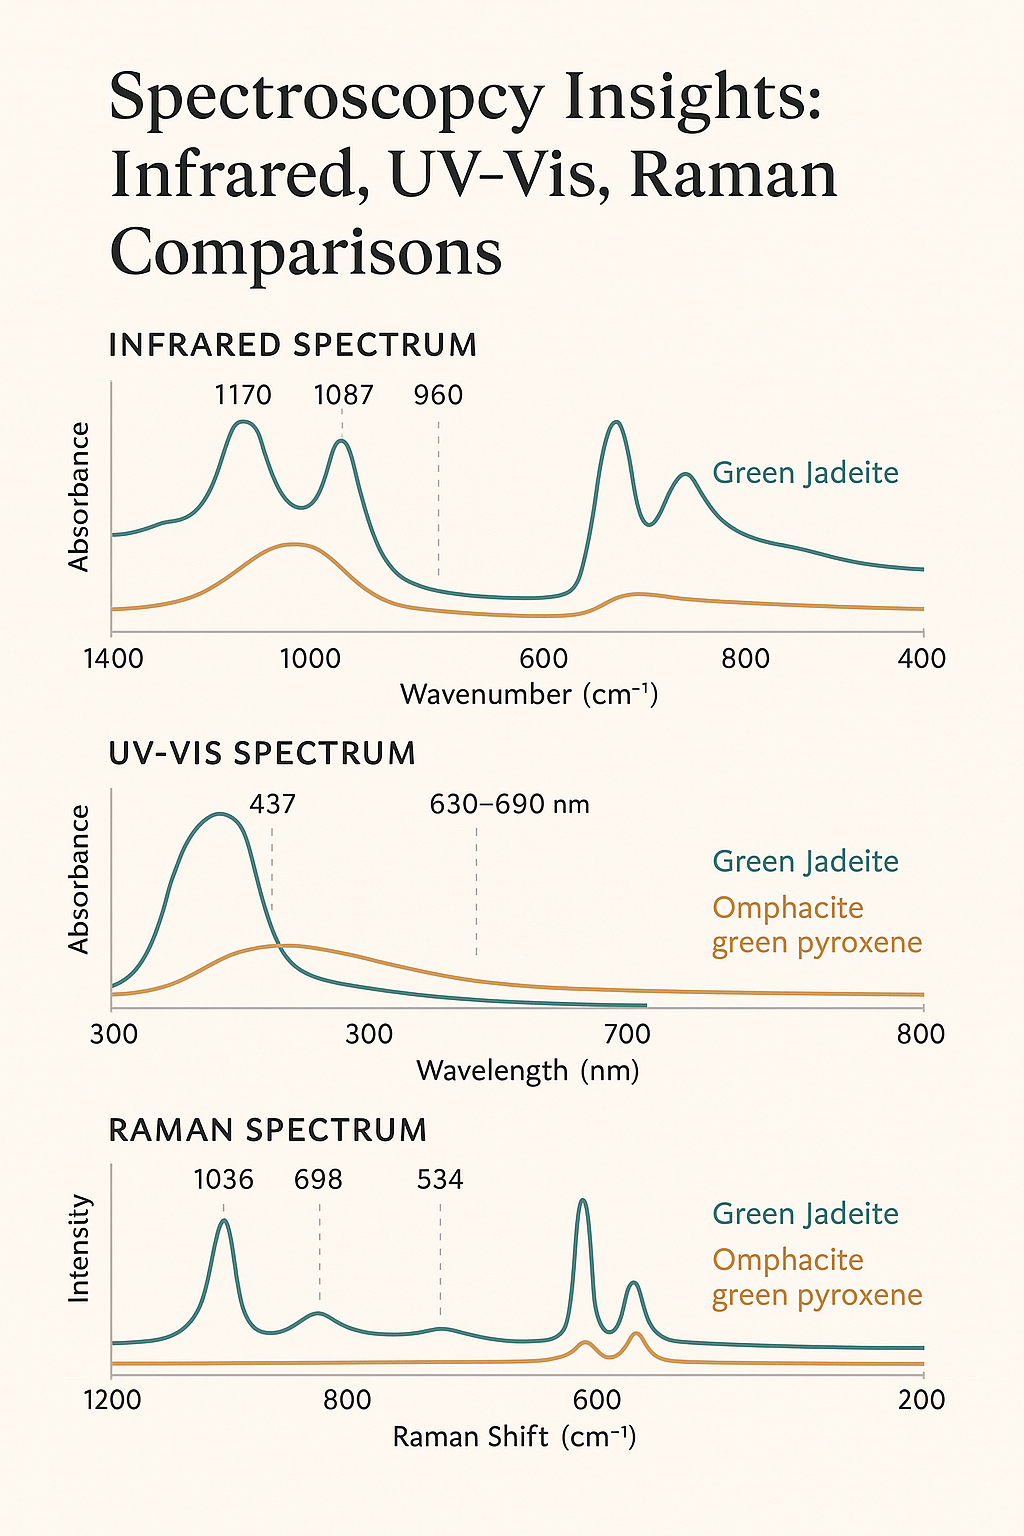
🔬 2. Infrared Spectroscopy (IR): Crystal Structure & Composition
IR spectroscopy detects vibrational modes within mineral lattices, especially in the Si–O and M–O bonds. For jadeite and related pyroxenes:
-
Jadeite shows strong peaks at:
- 1170 cm⁻¹, 1087 cm⁻¹, 960 cm⁻¹ (Si–O stretching)
- 585, 530, and 470 cm⁻¹ (Si–O bending and M–O stretching)
-
Omphacite (green pyroxene) shows shifts:
- Key mirror-image peaks at 1062 cm⁻¹ and 960 cm⁻¹, influenced by Ca, Fe, and Mg substitution
- Peaks are often broader and shifted to lower frequencies in Guatemalan samples due to Fe²⁺ and Ca²⁺ content
These peak positions help experts identify whether jadeite is pure (hard jade) or mixed with green pyroxene (omphacite phase).
💡 3. UV-Vis Spectroscopy: The Source of Color
UV-Vis analysis highlights how light is absorbed in the visible spectrum, directly tied to jadeite’s color.
-
Myanmar jadeite (rich in Cr³⁺) exhibits:
- Sharp peaks around 437 nm, 635–690 nm, and sometimes at 370–382 nm
- These are responsible for bright, saturated green and imperial tones
-
Guatemalan jadeite shows:
- Broader absorption bands due to Fe²⁺ in octahedral sites
- Sometimes full absorption from 600–760 nm, creating deeper, gray-green to smoky hues
- Presence of 940 nm weak bands in some samples suggests mixed valence states
These differences in absorption profiles offer key visual and compositional distinctions between origins.
📊 4. Raman Spectroscopy: A Non-Destructive Signature
Raman spectroscopy measures molecular vibrations, and is especially useful for identifying crystalline phases without damaging the sample.
-
Jadeite Raman peaks typically appear at:
- 1036 cm⁻¹ (Si–O stretch), 698 cm⁻¹ (Si–O–Si bend), 574, 525, 427 cm⁻¹
- Strongest signal at 1036 cm⁻¹
-
Omphacite and green pyroxenes show:
- Peaks near 1020 cm⁻¹, 678 cm⁻¹, and 369 cm⁻¹
Using multi-point scanning, gemologists can detect zones of omphacite or jadeite within a single sample—essential for evaluating mixed-composition stones.
🧠 Why This Matters
For collectors and brands alike, spectroscopy provides the scientific foundation for origin certification, quality grading, and transparency. It empowers buyers to distinguish between:
- Pure jadeite vs. pyroxene-dominant jade
- Myanmar vs. Guatemala origin
- Natural vs. treated stones
In the next article, we’ll explore how 3D Raman mapping reveals the internal mineral distribution of jadeite—bridging art and science in gemstone analysis.